IPAWS Overview – V1
The purpose of the IPAWS Section is to monitor both LAB and LIVE IPAWS alerts. In addition, this section has a sub-section to set-up specific IPAWS filtering parameters for designated locations.
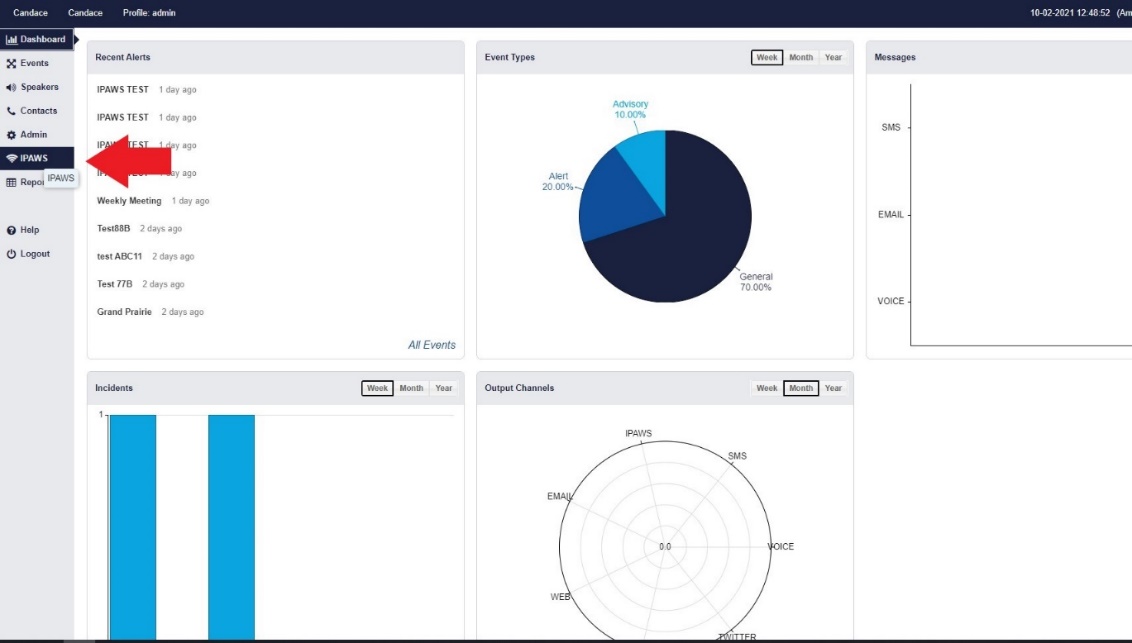
The first step upon logging in is to go to the ‘IPAWS’ section on the Toggle Menu.
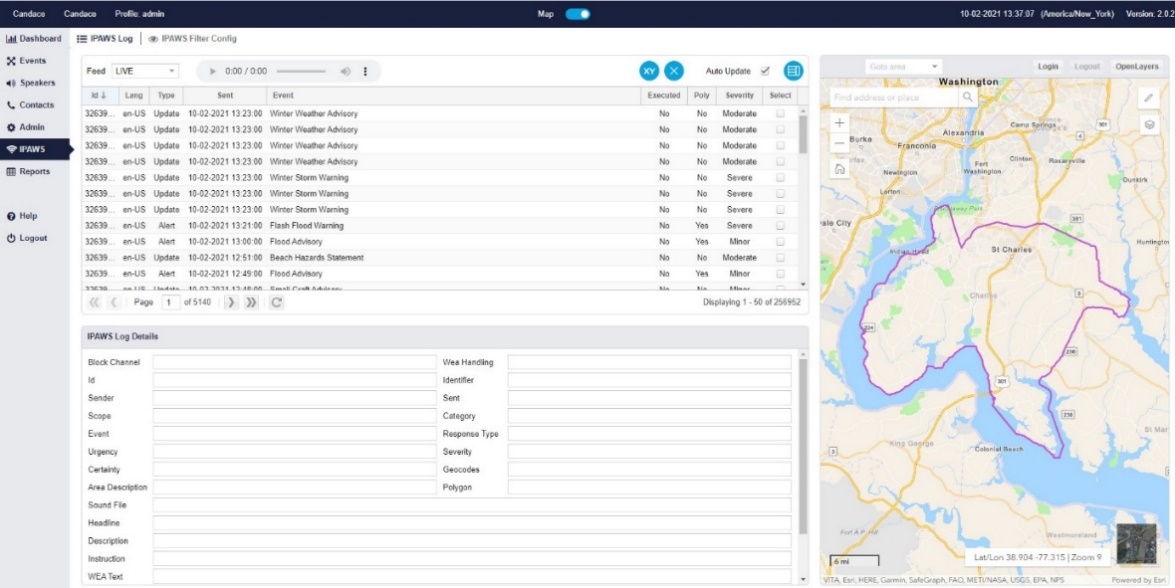
This will open into the IPAWS Log sub-section, which will showcase all current (LIVE) and practice (LAB) alerts on IPAWS.
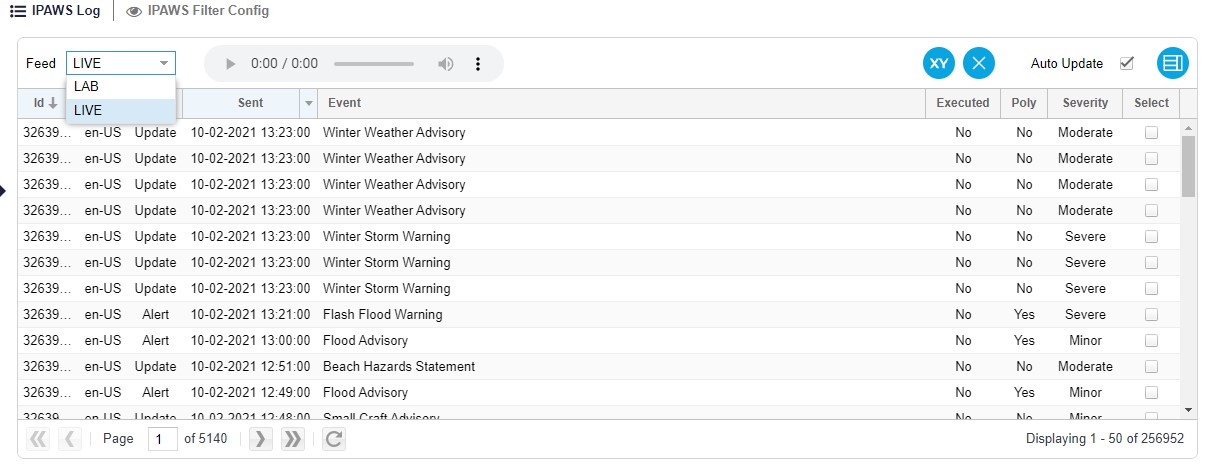
Along the top bar there is a ‘Feed’ drop down list, where you can alternate between the different IPAWS feeds. From the LAB feed (which is a secure training portal for IPAWS users), and the LIVE feed (which shows all active IPAWS alerts).
Beside the ‘Feed’ there is the media player, which can play the attached IPAWS audio files.
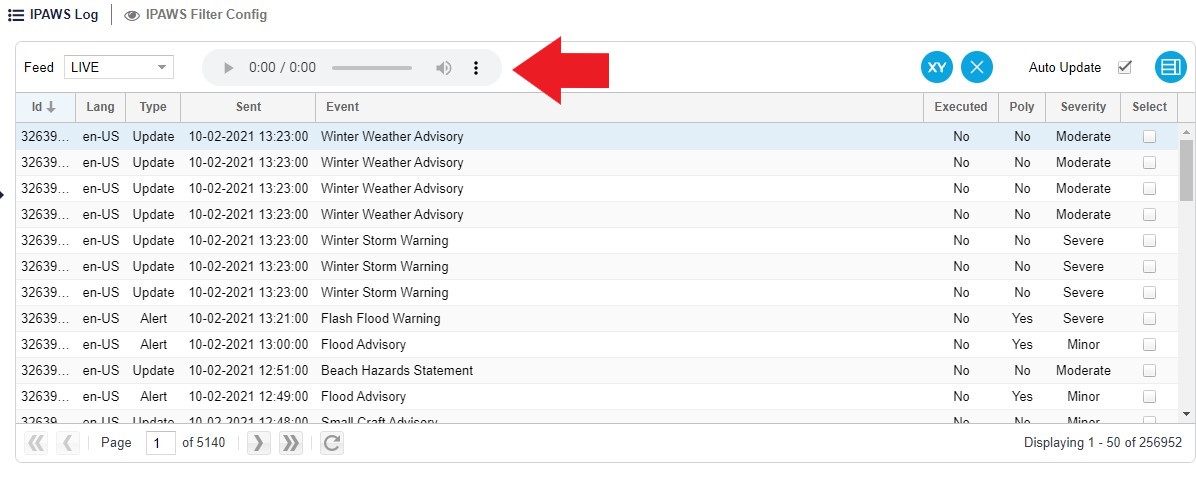
Next to the media player you have the XY button or the Open Coordinate button, which is where coordinates of latitude and longitude can be added to create a polygon on the map. And then beside that you have the ‘Remove IPAWS Polygon from the map button.


Next you have the ‘Auto Update’ checkbox, which by default is left checked or filled in, this is to show IPAWS alerts in real time. And then beside that there is the ‘restore columns to default’ button, which removes any filters or additional columns that have been added or left on.

The columns underneath are self-explanatory.
- ID: the specific IPAWS ID
- Language: for the assigned language of the alert
- Type: the type of IPAWS warning
- Sent: for the day and time the IPAWS alert was issued
- Event: what happened to trigger the alert
- Executed: if instructions were carried out
- Polygon: if a mapped polygon was included – which is an alternative to geocodes
- Severity: the classified severity of the event
- Select: to select and view the polygon attached to the alert
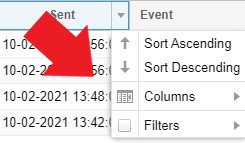
The columns are completely customizable and can be arrange for user preference.

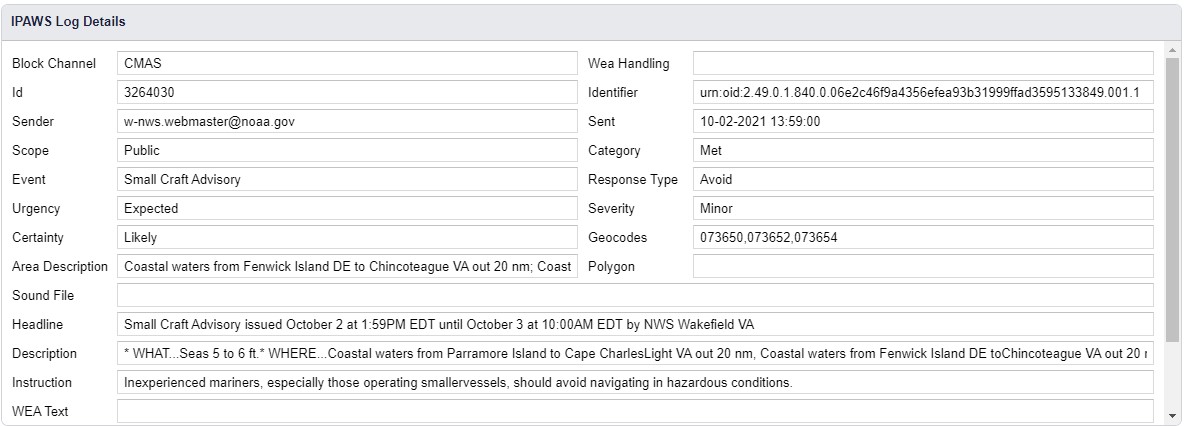
The lower half of the page consists of the ‘IPAWS Log Details’, which consists of a breakdown of IPAWS alert information. If an alert is selected it will auto-fill the logged information of that alert. The breakdown of the log information is as follows:
- Block Channel: which is any IPAWS channels that are disabled for the selected alert.
- ID: the specific IPAWS ID
- Sender: the user who issued the IPAWS alert
- Scope: whether the event affects public or private groups
- Event: what happened to trigger the alert
- Urgency: how fast emergency services should respond
- Certainty: the degree of expectancy of whether the emergency is taking place
- Area Description: description of the area
- Sound File: the name of the audio file – if one was used
- Headline: brief explanation of the occurrence
- Description: detailed explanation of the occurrence
- Instruction: instructions on how to deal with the event
- WEA text fields for English and Spanish
- Wea Handling: data specific to Wireless Alerts
- Identifier: The Identification Number for this alert in the IPAWS system
- Sent: for the day and time the IPAWS alert was issued
- Category: the type of emergency at hand.
- Response Type: how emergency services are expected to respond
- Severity: the classified severity of the event
- Geocodes: the location at which the event is happening
- Polygon: the mapped polygon coordinates
